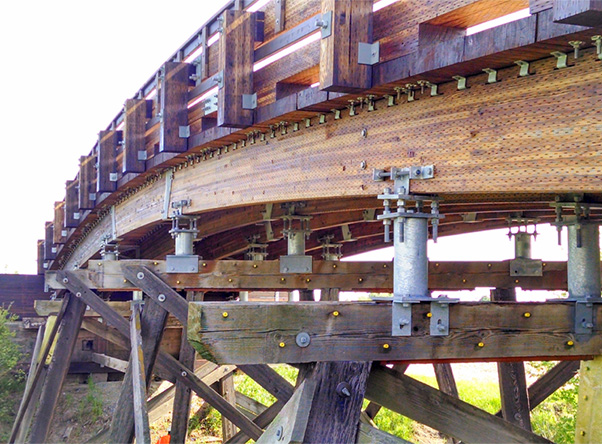
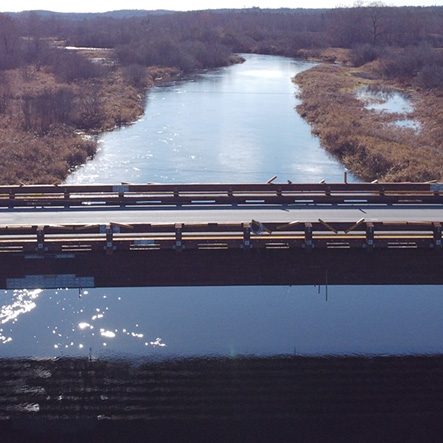
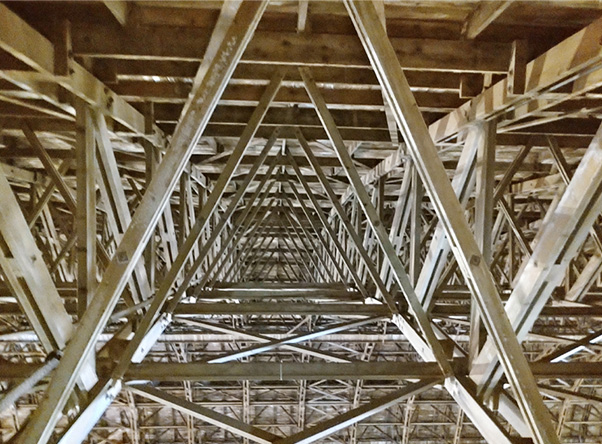
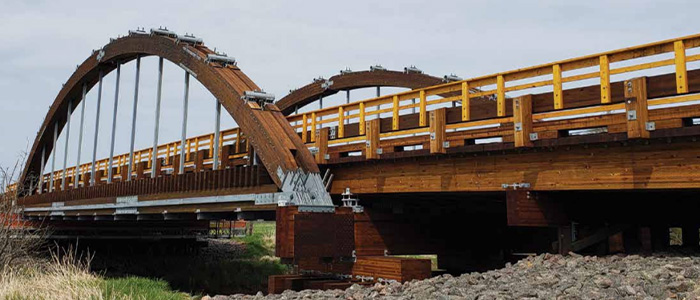
.Wood Research and Development (WRD) was commissioned to design a bridge assembly kit for a bridge project for Timber Restoration Services (TRS). The design strategy encompassed timber pile bent abutments, complete with wingwall piles, back and breast walls, and a 35-meter clear-span glulam girder-under superstructure. The vertical alignment and soffit height constraints were stipulated by the client.
The piles were driven during the month of July 2021 under the guidance of the client’s third party consultant. The effects of driving impacts by the I-8V2 diesel impact hammer were monitored by the consultant using the Pile Driving Analyzer (PDA) device, This device adopts dynamic wave formulae to determine end bearing and side friction resistance of piles. A drop hammer was used to complete the final stages of pile driving. The PDA was used to monitor the impacts by the drop hammer on Pile 12 on Abutment (eastern abutment (2)). The PDA device is shown in Figure 1-1 with a report for Pile 4 on Abutment 2 shown in Figure 1-2. This analysis was of the driving by drop hammer and a total resistance of only 536kN was recorded.

Figure 1-1: The Pile Driving Analyzer (PDA)

Figure 1-2: Sample of PDA report for Pile 4 on Abutment 2
Discrepancies between PDA input parameters and known data were established, including specific gravity (and specific weight), moisture content, as the piles were dry from seasoning, the modulus of elasticity, and the compression stress wave speed. A PET device (Pile or Phase Echo Tester) was used to measure the actual wave speed using known pile lengths, both in and out of the ground. The staff of WRD found that these results and other analysis work led to a modulus of elasticity that closely match the published value, factored for dry service conditions, representative of the actual piles, and factored as a dynamic modulus. These results were shared with the consultant prior to the final PDA assessment of Abutment 2 (AB2) piles during the final stages of pile driving with the drop hammer. However, these findings did not lead to changes in the consultant’s PDA pile capacity assessment of 536 kN for Pile 4.
Clause 6.11.2.1.1 (Commentary to CSA S6-14) states that “although the wave-equation analysis [as adopted by the consultant company and their use of the PDA and its CAPWAP software] is fundamentally correct, its results are only as accurate as the data used as input in the analysis. Wave-equation analysis has the potential to be used as the basis of pile design, provided that it has been calibrated with field static pile load tests”. The consultant has provided no evidence that calibration of the PDA with field static pile load tests has taken place. Various reports (WRD, 2021) have discussed the incorrect values for specific gravity, modulus of elasticity and compressive stress wave speed adopted as input for the PDA.
The piles on AB2 drove shallow to those on Abutment 1 and are founded in non-cohesive material, as shown on the bore logs of the consultant’s geotechnical report. Side friction resistance is minimal in non-cohesive material. However, PDA reports indicate the portion of side friction to total resistance ranged 16-50%, further indicating the PDA results were incorrect. Note that side friction for Pile 4 accounted for approximately 30% of the total resistance as seen in Figure 1-2.
In light of the above discrepancies and abnormal side friction resistances, the consultant maintains that the piles on AB2 have not achieved the required geotechnical resistance. The consultant therefore proposes to install two additional steel H piles (one each side of Abutment 2). The justification of this proposal is unfounded, based on incorrect data and acknowledges the uncertainties involved with dynamic analysis.
The Commentary to S6 (CSA S6.1-19) states the following:
The most reliable method for determining the geotechnical resistance of a pile is a static test. Static testing can be performed as either a proof test or for investigative purposes. A proof test is usually carried out to a predetermined load that is some multiple of the factored resistance of the pile… Tests for investigative purposes are usually carried out to either the failure load of the pile or to at least the calculated ultimate resistance of the pile.
Based on the above clause and the consultant’s deficient capacity rating for Pile 4 in AB2, which contradicted the WRD pile capacity calculations for same and used the actual drive logs and drop hammer final pile drive termination specifications, WRD determined to undertake proof loading of four piles in AB2 including Pile 4. The purpose of this report is to summarise the findings of the recent static axial testing of compressive loads for the piles on AB2, to verify the geotechnical resistance of the as-built piles. As required by the Canadian Highway Bridge Design Code (CSA S6-19), static testing was carried out in accordance with ASTM D1143/D1143M Standard Test Methods for Deep Foundation Elements Under Static Axial Compressive Load (2020) to measure the axial deflection of a vertical pile when loaded in axial compression. The report Static Load Test Brief (WRD, 2021) should be reviewed in conjunction with this report for details of the testing methodology, apparatus, and data collection scheme. Other recent WRD reports can be referred to for further information on the PDA results.
Static testing was carried out on four piles on AB2 with two successive stages of static proof loading. The first state of static proof loading was conducted with as much proof load as the apparatus could provide but in no case less than 650 kN. The second stage of static proof loading was conducted with the target maximum of twice the factored demand of any of the four piles. Pile 4 has the maximum demand at 321 kN and as such, the target static proof loading during the second stage was 650 kN. The other three piles don’t have near the factored demand of Pile 4 so 650 kN was well above the 2 times threshold. The tested piles have demand loads representative of the range of demand loads of all piles at Ab2. All piles were tested to a minimum load of 650kN or greater on August 19-20, 2021. Plunging failure on all but Pile 6 occurred in this first stage. The plunging failure occurred at loads in excess of twice the factored demand target loads. Instead of limiting the applied static proof load to twice the demand, the maximum static proof load afforded by the apparatus was applied. The threshold for static proof loading was the point at which the ram lifted the apparatus. This method, when combined with 10-minute load threshold (see proof load test criteria provided to the client prior to the proof loading test) allowed for a continuous high load instead of the kinetic energy approach of a drop hammer. This is important as timber piles act like a dash pot often such that the kinetic energy resistance is higher than continuous load energy resistance. This feature in timber piles can be more obvious when they are not predominately tip bearing.

Figure 1-3: The load cell registering 65 tonnes on the pile.

Figure 1-3: Complete setup of static load equipment to produce the 65 tonne loading on the pile.
The consultant’s results were heavily weighted to side friction resistance and the use of longer time interval load increments during the first state of static proof loading tests by WRD was targeted to show that tip bearing was indeed the predominate resistance factor. The results have shown that the percentage resistance attributed to side friction in the non cohesive soils found in AB2 by the consultant’s PDA test results is wrong. A second stage of testing took place on August 23, 2021, where the nominal resistances of all four piles, factored by a low geotechnical resistance factor of 𝜙𝑔𝑢 = 0.5, exceeded ultimate demand loads. This second test was performed using a maximum proof load of 650 kN to confirm that the tail end plunging witnessed in the first stage testing would not occur again and was not relevant in the static proof load analysis.
It has been concluded that the timber piles at the bridge have achieved their intended geotechnical resistance and therefore, the proposal to install additional steel H-piles is not warranted. Subsequently, it is recommended that construction work can proceed.
Geotechnical Resistance Factor and Test Load
For deep foundations subject to static axial compressive tests, the geotechnical resistance factor for the ultimate limit state 𝜙𝑔𝑢 ranges from 0.50, 0.60 and 0.07, for “low understanding”, “typical understanding” and “high understanding”, respectively.
The design of the geotechnical resistance of the piles was based on the findings of the consultant report Geotechnical Investigation Bridge Replacement (2020) and have been reviewed by third-party Brunswick Engineering as a quality assurance measure. Furthermore, other static testing methods have been carried out to understand the specific gravity, modulus of elasticity and compressive stress wave speed of the piles. As such, a “high understanding” can be demonstrated. However, it is anticipated that the consultant will be hesitant to accept a geotechnical resistance factor higher than 𝜙𝑔𝑢=0.50, which represents a “typical understanding” of their dynamic analysis. The lower value for a typical understanding of the dynamic analysis is indicative of the higher range of uncertainties inherent to the PDA analysis over static testing.
Demand Loads
As the piles have been installed, it was possible to review the demand pile loads based on actual pile stiffness and actual pile location as estimated by the Timber Restoration Services field staff versus the original working drawing pile locations. The as-built pile locations differ from the original design intent and therefore unsymmetrical pile cap stiffness is introduced, resulting in unsymmetrical demand loads along each cap of each abutment.
The as-build pile demands, unfactored and factored, are presented in Table 2-1. The pile resistances shall incorporate a load sharing factor (or group factor) of 1.11 to enhance resistance which is possible once the pile cap has been installed to allow the piles to act as a system. The loads in Table 2-1 does not include the load sharing factor as this is a factor not commonly used in Canada as it is in United States.
Further, it is important to note that at the time of this report, preparation field data for pile location had been received from professional licensed client field surveyors. This data has been utilized in the last days by the WRD engineering staff utilizing the Lusas structural software. This analysis has resulted in a further reduction of the maximum factored pile demand load of 298 kN. To prevent confusion within the client and consultant review team, this lower number has not been utilized in this report and the higher factored demand number has instead been kept in the analysis. The static proof loading results still pass easily. Thus, there is an even greater cushion/safety margin in the piles than revealed by the report created.
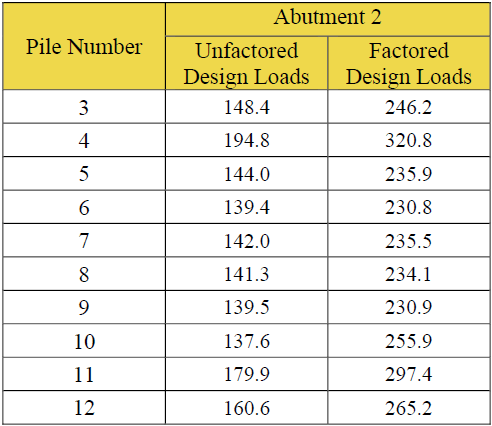
Table 1-1: As-built pile demand loads of Abutment 2
The maximum factored pile demand, as specified in Table 2-1, is 321kN for Pile 4. The original maximum factored pile demand was 377kN. Note that Piles 1-2 and 13-14 are piles located on the wing walls adjacent the abutments.
Refinement of Demand Loads
Since the issuance of the Static Test Brief (WRD, August 16, 2021), the placement of the girders has been revised to reflect the as-built pile locations, as shown on the WRD structural drawings dated August 20, 2021. The repositioning of the girders and recently received the client’s pile survey data has revealed a further improvement to the distribution of superstructure loads as discussed above. The revised loads presented in Table 2-2 are technically “as-built” demand loads, however for the purposes of the static test, the
Table 2-1 shall be considered as discussed above. It is important to note that the demand loads of Table 2-2 have been verified using pile stiffnesses obtained from the static test results.

Table 2-2: As-built pile demand loads based on revised girder locations
Target Static Test Load
ASTM D1143/D1143M recommends the maximum load to be applied should reach a failure load from which the EOR may determine the ultimate axial static compressive load capacity of the pile(s). The piles are Douglas fir and have been sourced from a US supplier due to supply chain issues relating to Covid-19. The piles are larger than the minimum sizes as specified by the original design. Therefore, the appropriate consensus code governing the characteristics of the piles at the bridge is the National Design Specification for Wood Construction (NDS 2018) and its Supplement.
Conducting a static test in accordance with ASTM D1143/D1143M to the ultimate axial static compressive resistance of 1554 kN was not feasible. For the purposes of this test, the target load adopted a geotechnical resistance factor of 0.50, as adopted by the dynamic testing by the consultant, and representing a conservative “low understanding” of the static test. Based on the maximum demand load of 321kN, the target static load was:

Piles Tested
The piles of AB2 of the project drove shallow compared to the piles at Abutment 1. The consultant argues that the piles at AB2 have not achieved the required geotechnical resistance, based on their dynamic assessment of the driving using the PDA. Therefore, the static testing was carried on Pile 4, Pile 5, Pile 6 and Pile 7 of AB2.
Preliminary Geotechnical Axial Capacity of Piles
The embedment depths of the piles are as follows:
• Pile 4 – 4750mm
• Pile 5 – 4115mm
• Pile 6 – 4570mm
• Pile 7 – 4115mm
Given that Pile 4 has the highest demand load, embedment of 4750mm shall be considered in the following calculations. At these depths the piles are founded into non-cohesive material, as reported by the consultant’s geotechnical report (2020). The geotechnical axial resistance of the piles can be estimated by adopting the methodology as presented by the Canadian Foundation Engineering Manual (CFEM 2006). The methodology presented by the manual includes tabulated values for the combined shaft resistance coefficient β and the toe bearing capacity factor, Nt.
Table 2-3 calculates a range of geotechnical axial capacities of the piles for ranges of β, Nt and the soil unit weight. The mid-range geotechnical axial capacity is 746.5 kN.
It is recognised in this instance that the calculations in Table 2-3 is representative of a “low understanding” of the prediction of geotechnical axial resistance, in line with that as adopted for the target static test load. It is noted that the mid-range geotechnical axial capacity is 746.5 kN is more than twice the ultimate pile demand load.


Table 2-3: Estimation of pile geotechnical axial capacity
More detailed calculations for geotechnical axial capacity of the piles on AB2, for the highest loaded piles in relation to the boreholes advanced by the consultant on AB2, are presented in Appendix B. Calculations in this appendix are based on the original maximum demand load of 377.4kN and a geotechnical resistance factor of 𝜙𝑔𝑢=0.50 which is applicable for a “typical understanding” of the dynamic testing, as adopted by the consultant. The geotechnical resistances of Pile 4 (Borehole BH03) and Pile 10 (Borehole BH04) are 845kN and 1038kN respectively.
Data Interpretation Methodologies
The Canadian Highway Bridge Design Code (CSA S6-19) does not provide any specific guidance on how to interpret data from static axial compressive tests. The Commentary to S6 (CSA S6.1-19) states the following:
Load tests should be carried out in general conformity with ASTM D1143. The measurement of pile compression and tip movement by a telltale or a sensor attached to the pile tip will enhance the value of a static test (CFEM, 2006; Brinch Hansen, 1963; Chin, 1970; Davisson, 1972; Fellenius, 1990; and Kondner, 1963). A load cell may be required for an accuracy of 2%.
The CFEM (2006) provides details the following methodologies for interpreting the static axial compressive test results:
• The Offset Limit Load (Davisson)
• The Brinch-Hansen Failure Criterion
• The Chin Failure Criterion
The Offset Limit Load and the Brinch-Hansen Failure Criterion have been adopted to interpret the data collected from the static axial compressive tests of the piles at the bridge.
The Offset Limit Load
The Offset Limit Load method is intended for driven piles that produces a movement of the pile head. This method provides a conservative failure load that is often more a value that represents the boundary between semi-elastic and semi-plastic ranges of pile movement behaviour. This method can be too conservative and can deviate significantly from the plunging failure, which, when it occurs, is then conceived as the true ultimate failure load. The relationship between the load and movement is plotted, as shown in Figure 3-1. The elastic deformation Δ is computed from:

Where:
Q = the applied load (kips)
L = the pile length below the measurement location (in)
A = the cross-sectional area of the pile (in2)
E = the modulus of elasticity (MOE) of the pile material (ksi)
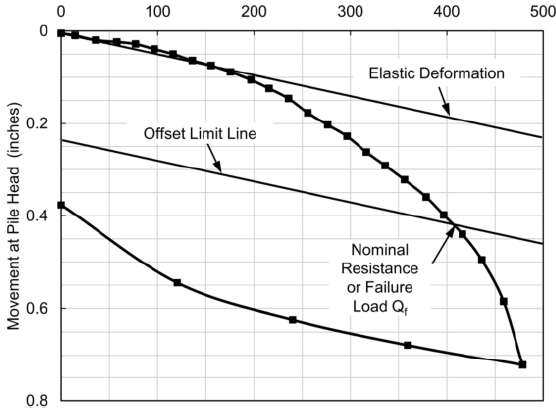
Figure 3-1: Typical load-movement curve for axial compression load test
The offset line is a plot of the measured pile head movement at the nominal resistance, sf, which is given as:

Where:
b = the pile diameter (in)
Site & Pile Preparation
The following site preparation procedures were carried out:
1. Earthworks were completed around the piles to the final design elevation
2. The piles did not interfere with the construction of the load-application apparatus, placement of the necessary testing and instrumentation equipment, and observation of the instrumentation.
3. Removed any damaged or unsound material from the pile top and prepared the surface so the pile tops were perpendicular to the pile axis with minimal irregularity to provide a good bearing surface for a test plate.
4. Installed a 25mm solid steel test plate perpendicular to the long axis of the test pile that covered the complete pile top area.
5. To minimize stress concentrations due to minor irregularities of the pile top surface, the test plate was set directly on the cleanly cut top of the pile.
Apparatus
General
The apparatus for applying compressive loads to the piles complied with ASTM D1143/D1143M. The apparatus designer ensured the apparatus was capable of safely applying the target static test load.
The test load apparatus was aligned with the longitudinal axis of the pile to minimize eccentric loading. Lateral deflection or buckling did not occur and therefore it was not necessary to provide lateral braces.
The jack included a hemispherical bearing to minimize lateral loading of the pile or group. The hemispherical bearing included a locking mechanism for safe handling and setup. The bearing plates, hydraulic jacks, and hemispherical bearing were centered on the test beams and pile.
Bearing plates extended the full diameter of top area of piles to provide full bearing and distribution of the load.
The engineer of record approved all loading apparatus, loaded members and loading procedures. The test beams, load platforms, and support structures were of sufficient size, strength, and stiffness to prevent excessive deflection and instability up to the maximum test load.
Hydraulic Jacks, Gauges, Transducers, and Load Cells
The hydraulic jack adopted was the Enerpac RCH1003, as shown in Figure 5-1, which was recently calibrated. The datasheet for the jack is presented in Appendix C. The operation of the jack conforms to ASME B30.1 Jacks and had a nominal load capacity of 931 kN, which exceeded the maximum anticipated jack load by 53% (minimum additional 20% required). The jack, pump, hose, fittings, and gauge used to pressurize the jack were rated to a safe pressure corresponding to the nominal jack capacity. The pump and pressure gauge are shown in Figure 5-2.

Figure 5-1: Enerpac RCH1003 hydraulic jack

Figure 5-2: Pump and pressure gauge used with hydraulic jack
The jack had a travel of 76mm. This was greater than the sum of the anticipated maximum axial movement of the pile plus the deflection of the test beam and the elongation and movement of any anchoring system, and not less than 15% of the average pile diameter. The ambient temperature during the test ranged 20-22° Celsius.
Applying Load
Two test beams were centered on the test pile and were of sufficient size and strength to avoid excessive deflection under load. The test beams were supported by temporary timber beams on temporary timber piles located greater than 1.5m from the test pile.
The adjacent as-built piles were used to provide temporary support to the test beams as the apparatus was assembled. The timber stubs were positioned on the as-built piles with timber wedges for stability.
A steel barge filled with water was centered on the test beams and supported on eight driven piles. Additional mass concrete blocks, weighing a total of 89kN were placed on top of the steel barge. The total weight of the barge and the concrete blocks exceeded 800kN. The steel box and concrete blocks are shown in Figure 5-3. The test loads were applied to the pile by jacking against the underside of the steel box.
Refer to Figure 5-4 for a typical schematic of the loading of the pile. Note that temporary timber piles were used in lieu of the timber cribbing.


Figure 5-3: Steel barge with concrete blocks

Figure 5-4: Schematic of Direct Loading on a Single Pile Using Weighted Platform. Other support systems as approved by the EOR maybe implemented. This diagram for concept purposes only.
Measuring Instruments
The apparatus included a primary measurement system and a redundant, secondary system. Digital string potentiometers (string pots) were adopted as the primary system to obtain the most precise measurements. The redundant system was used to check top movement data and provide continuity in the event the primary system was disturbed or reset.
The string pots were installed axially along the length of the pile. Two pairs of string pots were placed along the pile axis, oriented symmetrically opposite each other and equidistant from, and parallel to, the pile axis. Care was taken not to position the string pots at changes in the pile itself such as diameter or knot locations, and the like.
The redundant system consisted of surveying instrumentation. Movement readings were taken on a single fixed point with referenced to a permanent benchmark located outside of the immediate test area.
Procedure
The static test procedure was in accordance with the Quick Test method (“Procedure A”) as detailed by ASTM D1143/D1143M (2020), as follows:
1. The zero-load readings of strain gauges and survey taken before placing the test beams and platform on the pile. Time of test commencement was noted.
2. A total test load of 650 kN was applied in thirteen 50kN increments.
3. Each load increment was added in a continuous fashion and immediately followed the completion of movement readings for the previous load interval.
4. The load was constant for 10 minutes per interval.
5. The load was removed in five 130kN decrements, the load was kept constant for a time interval of 10 minutes.
The time, applied load, movement readings for each string pot (“SP”), and displacement survey were taken at one-minute intervals after completing the application and removal of each load increment. Relevant field notes, including notations of any interruptions or unusual occurrences during testing were recorded. The raw string pot data contains a significant amount of data. This data is available in electronic form upon request. Graphical representations of the string pot data are presented herein.
Modulus of Elasticity
The modulus of elasticity is a specific criterion in design and is a parameter of elastic deformation, Δ and is the product of the material density and the square of the compression stress wave speed through the material. Loads used in conjunction with the modulus of elasticity to measure deformation are unfactored loads (SLS).
The time of flight of a compression stress wave through Douglas-fir is often sited by PET and PDA manufacturers as 10,600 – 14,500 fps (3230 – 4420 m/s), with typical speeds of 12,000 fps (3657 m/s). These values are not confirmed by published data for wave speed parallel to grain. Published data is much higher. Further, some PET device manufacturers are now using 17,000 fps which tends to be above published data.
Since completing the pile driving, a PET device was used with known lengths to verify the wave speed. The actual speeds measured by the PET were higher than typical values used by the PDA devices. These matched published data much more closely being in a range 15,560 – 17,000 fps (4744 – 5181 m/s), indicating a high range specific gravity of 0.60. The modulus of elasticity can therefore be found:

USION
The driving of the piles at Dillman’s Bridge was monitored by dynamic analysis using the Pile Driving Analyzer (PDA). The data input to this device did not represent the true nature of the pile material and subsequently, the results were erroneous. The geotechnical consultants controlling the pile driving, the consultants concluded the piles on Abutment 2 did not achieve the required ultimate geotechnical resistance.
The PDA results included a range of end bearing and side friction resistance for the piles by internal signal matching and adjusting of soil parameters to suit each pile. The subsoil conditions did not vary significantly across the site. The piles on Abutment 2 are founded in non-cohesive material where side friction is minimal. As seen in Table 2-3, the shaft friction was estimated to contribute less than 1% of the total geotechnical axial capacity. However, the portion of side friction to total resistance ranged 16-50%, further indicating the PDA results were incorrect. The PDA test results showed that P4 in AB2 had a capacity of 536 kN which was 16.5% under the required capacity of 642 kN with a GRF of 0.5. Put in clearer terms, the PDA predicted utilization was 120% when the actual utilization factor, as per static proof loading – the gold standard in pile capacity assessment – was 82% even when using a very conservative site understanding GRF of 0.6 (up to 0.7 is actually allowed by CSA S6-19). That is a nearly 40% error in the PDA result even when using conservative factors.
As the Engineer of Record, WRD has previously submitted numerous reports to demonstrate the PDA results were incorrect, yet the consultant maintained their position that the pile driving on Abutment 2 was unsuccessful, utilizing a low geotechnical resistance factor which is in indicative of the uncertainties involved with dynamic analysis. In fairness to the consultant they also recommended at least one static proof load test as their report indicated there was potential for error associated with uncertainty with regard to site soil conditions. The staff of WRD agreed with this part of the consultant’s recommendation and conducted the proof loading tests. These tests have shown that the PDA assessment was wrong. Further, it should have been clear to the client, as it was to WRD, that the shallow driven AB2 piles were clearly in non-cohesive soils as shown by the consultant’s own site bore logs. The reliance on PDA CAPWAP software that was heavily skewed to side friction pile capacity was, and still is, a skewed point of error as pointed out by WRD staff in previous reports. This static proof loading exercise has shown that WRD’s assessment of pile capacity and suitability to carry demand loads was right.
To compensate for the assumed low resistance of the piles, the consultant proposed to install a steel H pile to each side of Abutment 2. WRD gave advice that it would not be liable for any short- or long-term damage of the timber piles, timber cap and any other performance issues associated with the installation of the steel piles on Abutment 2 for the following reasons:
• The proposal conflicts with the requirements of CSA S6-19
• The resistance of the timber piles is likely to reduced due to pushing and shoving by the steel piles Differential stiffness between steel and timber piles cannot be quantified and the timber cap is likely to be subject to unfavourable stress distributions that the consultant cannot demonstrate
• Welding of the steel pile cap onsite provides for durability issues that will lead to increased maintenance costs.
Subsequent to all of the above considerations, WRD determined to, at its own expense, complete static axial compressive load testing on piles at Abutment 2. This testing was conducted to establish the true pile capacity. It has been shown that the piles actually have the required ultimate geotechnical resistance and further they have demonstrated this capacity without excessive movement or plunging failure. This report has presented the testing methodology, data and analysis of this testing.
Two stages of static testing took place in accordance with ASTM D1143/D1143M (2020), and two methods of data interpretation were adopted, as recommended by the Canadian Highway Bridge Design Code (CSA S6-19), its Commentary, and the Canadian Foundation Engineering Manual (2006). Data was collected using string pots and surveying equipment. Interpretation of the data was carried out by the Offset Limit Load and also the Brinch-Hansen Failure Criterion where plunging failure occurred.
The minimum proof test load was 650kN utilized in both stages of the proof loading, which exceeds the maximum required geotechnical resistance of the piles also adopts a conservative geotechnical resistance factor of 𝜙𝑔𝑢=0.5. This GRF represents a “low understanding” of pile performance through static testing. The value of this factor matched that as adopted by the consultant, representative of a “typical understanding” of their dynamic analysis.
The results of Stage 1 indicated the nominal resistance of Pile 4 did not exceed the required geotechnical resistance by any of the data or interpretation methodologies. To prove that Pile 4 capacity did in fact exceed the required capacity using all forms of analysis it was deemed necessary to retest Pile 4 to verify if any erroneous data were recorded or if significant rebound occurred (or plunging) which would otherwise render Pile 4 to be incapable of supporting the demand load with the conservative geotechnical resistance factor. It was decided to retest all four piles to confirm the same since the set up was in place.
Stage 2 test results required string pot data for all four piles to be extrapolated beyond the test load. This indicated that plunging failure did not occur, which was supported by assessment to the Brinch-Hansen Failure Criterion. Extrapolation of data is not recommended by CSA S6-19 and therefore, the ultimate geotechnical resistance of the piles was concluded to be equal to or greater than the minimum static proof test load of 650kN. It is likely that the ultimate geotechnical resistance of the piles could range to 740kN, should the testing load have been high enough to proof same in all the piles. This range of loading was nearly achieved with some piles as shown by the data.
It has been shown that even with such a conservative geotechnical resistance factor for static testing, the ultimate geotechnical resistance of the piles exceeded their demand load for the ultimate limit state. Given the success of Stage 2 testing, and the comparable extrapolated offset limit loads to the prediction model, it was reasonable to adopt a geotechnical resistance factor of 𝜙𝑔𝑢=0.6, representing a “typical understanding” of pile performance. The utilisation of the piles (demand / resistance) for the ultimate limit state ranged 60-82%. Geotechnical axial displacement of the piles after Stage 2 testing was negligible. Rebound of only Pile 5 exceeded the strain of the pile material, resulting in geotechnical displacement due to the test load of only 1.4mm. Given the pile driving termination criterion was three blows for 1/8in (3.175mm) movement per blow, geotechnical displacement at the unfactored load for the serviceability limit state is well within limits. Further, considering unfactored demand with actual proof loading values the piles had nearly three times the required capacity. When considering the group factor for resistance and recent reduced pile demand as a result of the client site pile survey data this safety factor become much larger. Clearly the AB2 pile capacity in Dillman’s Bridge is way more than suitable for use without additional pile driving with steel H section piles.
In summary, all piles subject to the static axial compression load test resulted in geotechnical resistances that exceeded their ultimate demand loads and without any significant geotechnical displacement. All four piles are suitable to support the superstructure and there is no need to install the steel H piles or strengthen the substructure by any other means.


